
Your InBody results, explained.
Sixty seconds on the device produces one page of numbers. Here is what each section means in plain language, and which of them we read first.
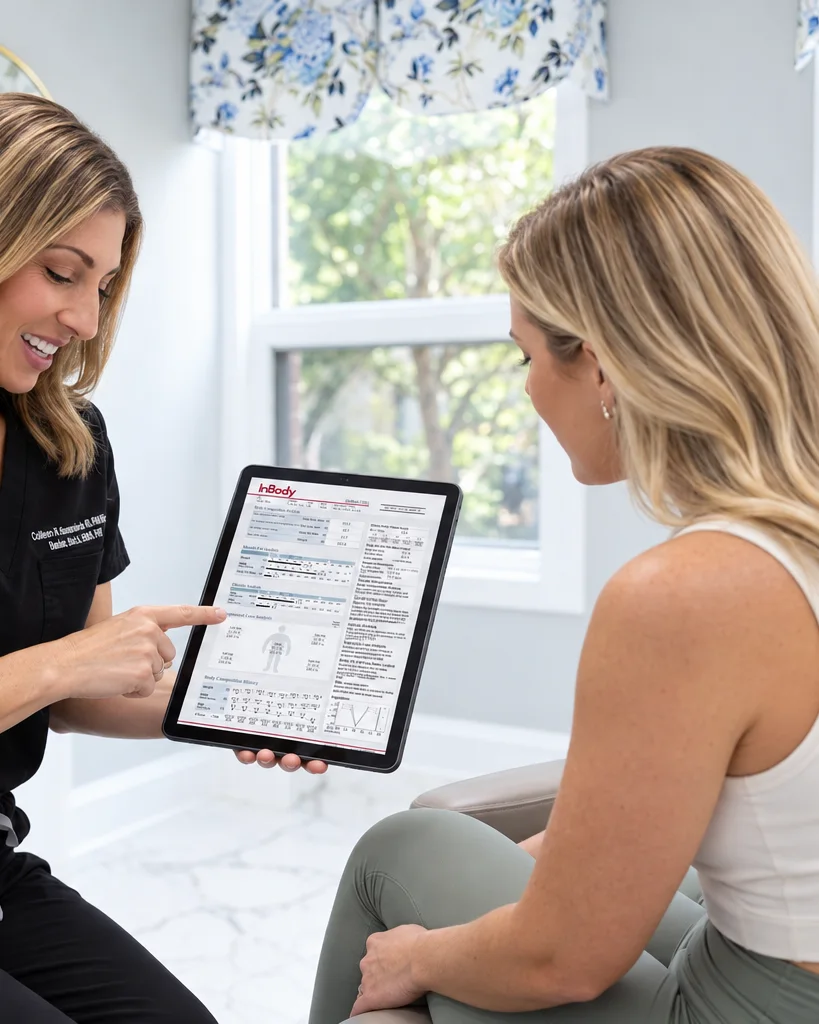
Eight sections, one page.
Open any section to see where it sits on the sheet and what it is telling you. Most people find the first three answer the question they came in with.
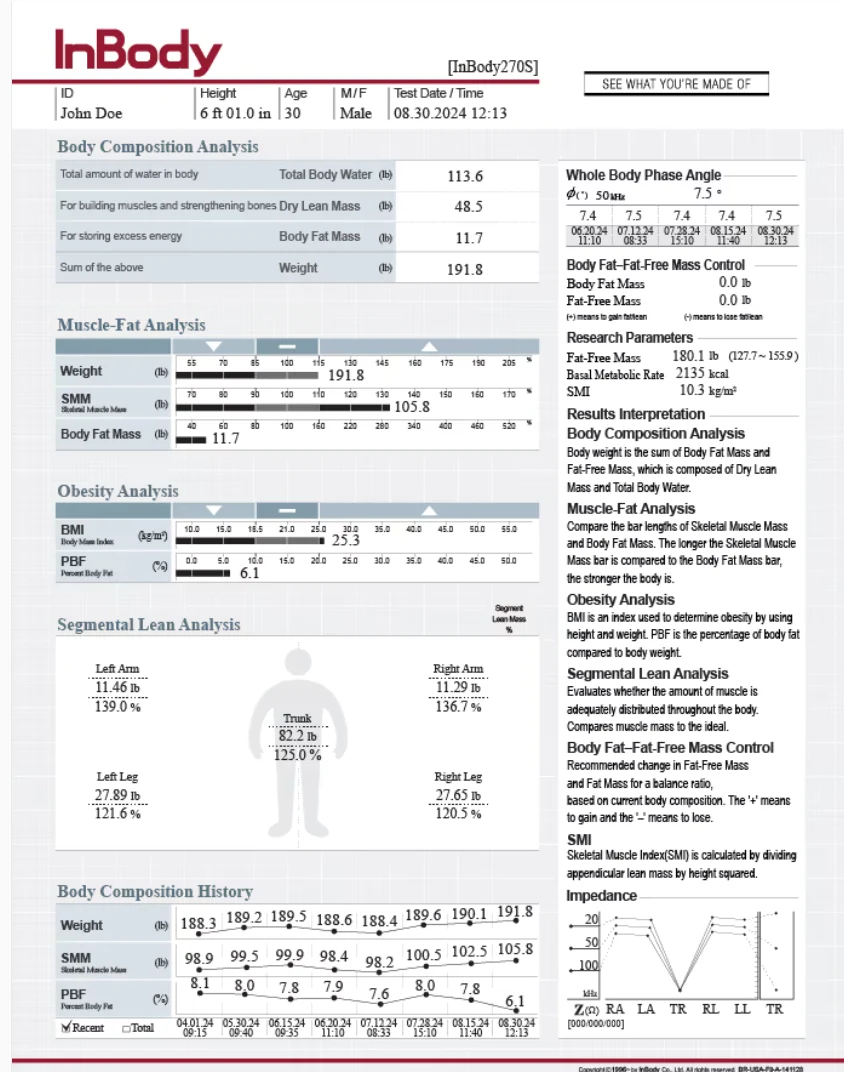
Your weight, split into what it is made of.
Weight is the sum of three things: total body water, dry lean mass (the protein and mineral in your muscle and bone) and body fat mass. Water plus dry lean mass is your lean body mass, everything that is not fat. If dry lean mass rises between scans, you have most likely gained muscle.
What we watchDry lean mass rising, fat mass falling.
How you compare with the average for your height and sex.
Three bars: weight, skeletal muscle mass (the muscle you can build with training) and body fat mass. 100% is the average for someone of your height and sex, so a weight bar at 130% is 30% above average. Join the ends of the three bars and they form a C, an I or a D, which tells us your body type at a glance.
What we watchThe shape the three bars make.
Body fat percentage, with BMI alongside for reference.
Percent body fat (PBF) is fat mass divided by weight. It tells you what your weight is made of, which BMI cannot: two people of the same height and weight share a BMI even if one is muscular and the other is not. InBody's recommended PBF range is 10 to 20% for men and 18 to 28% for women. The WHO range for BMI is 18.5 to 24.99.
What we watchPBF, not BMI.
Lean mass in each arm, each leg and your trunk.
The figure shows lean mass per segment in pounds and, underneath, a percentage: 100% means enough lean mass to support your body weight. This is where imbalances show, a developed upper body on under-built legs, or one side carrying more than the other.
What we watchEvery segment at 100% or above, left and right roughly matched.
Your last eight scans on one graph.
Weight, skeletal muscle mass and percent body fat are plotted from each previous test. This is where progress actually shows. A drop in weight can look like a win until the graph reveals it came from muscle rather than fat, which is why we suggest retesting every three to six months.
What we watchMuscle holding or rising while fat percentage falls.
A read on cellular health.
Phase angle reflects the integrity of your cell membranes, and it can shift before other measures do. InBody's recommended range is 4 to 6 degrees for women and 5 to 7 for men; athletic people often sit higher. A low number is not a diagnosis, but a steady decline is worth watching.
What we watchThe trend across visits more than any single reading.
What would move you to target.
The sheet suggests how much fat mass to lose, or lean mass to gain, to reach a target body fat percentage (15% for men, 23% for women). It never recommends losing lean mass. We treat it as a starting point and set the real goal with you.
What we watchA plus sign means gain, a minus means lose.
The numbers clinicians use.
Fat-free mass is everything except fat. Basal metabolic rate is what your body burns at rest, a baseline for planning nutrition rather than a daily target to eat. Skeletal muscle index (SMI) is arm and leg muscle relative to height, which we use to screen for low muscle mass.
What we watchBMR as a floor, never a ceiling.
Three numbers that matter more than the scale.
- 18–28%PBF
Body fat percentage
InBody's recommended range for women; 10 to 20% for men. We read this before BMI, because it says what your weight is made of.
- 100%SMM
Skeletal muscle mass
The average for your height and sex. Muscle you can train is the number most worth protecting when weight comes off.
- 4–6°Phase angle
Cellular integrity
The recommended range for women; 5 to 7 degrees for men. A quiet marker that tends to move before anything else does.
C, I or D.
Join the ends of the weight, muscle and fat bars and the line makes a letter. It is the quickest read on the whole sheet.
C-shape
Muscle shorter than weight and fat. The goal is to bring fat down and muscle up, whatever the scale says.
I-shape
The three bars line up. Proportional, and a good place to work from in either direction.
D-shape
Muscle longer than weight and fat. The athletic profile; keep fat in range while muscle holds.
Bars, top to bottom: weight · skeletal muscle mass · body fat mass
Small things that keep the numbers honest.
- 3–4 hoursNo food, caffeine or exercise beforehand.
- HydrateNormally. Do not load up or restrict water.
- Same timeTest at a similar time of day each visit.
- 60 secondsBare feet on the plate, hands on the grips. That is the whole scan.
See what you are made of.
An InBody scan with a clinician reading it starts at $50. Add VO2 max testing and the two together start at $250.
Section descriptions are condensed from InBody's result-sheet guide and are for education only; they are not medical advice. Your clinician interprets your sheet against your history and goals. Ranges quoted are InBody's defaults and can differ by device programming.